About QChartist
QChartist is a Free Technical Analysis Charting Software.
Receive Free Forex, Stocks and Crypto Signals by email for Profitable Trading. Add your website to the QChartist Finance Directory. Find everything you need about finance. Visit the QChartist blog, a lot of information about trading, and other subjects of interest.
Location & Directions for QChartist

Services QChartist Offers
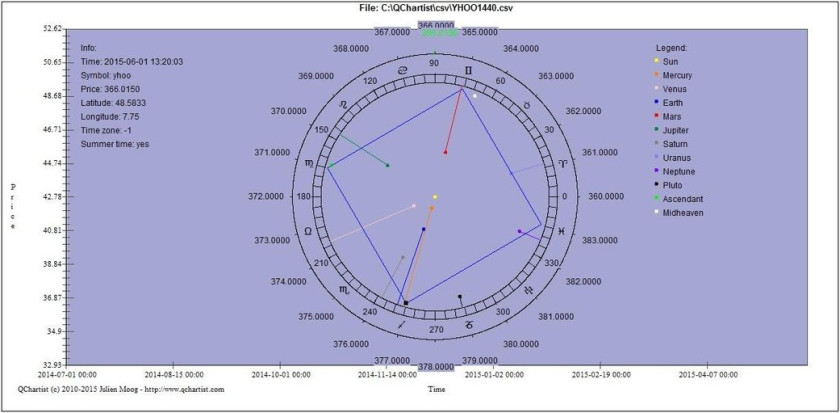
QChartist offers a wide range of products and services to help traders maximize their potential in the financial markets. Our products include charting software for making technical analysis on any data like Forex, Stocks; realtime quotations thanks to perl scripts; astro indicators and functions from a library for astronomical calculations; geometrical shapes on charts; programmable indicators from data; filters or merging datasets; ability to change the timeframe multiplier; logarithmic axis type; polar chart type; drawing indicators on charts and creating new ones; creating exotic pairs with the mixer tool; building automated analysis with signals and alerts; integrated third party trading platform for market orders execution.
- Business Directory
- Cryptocurrency
- Directory Listings
- Stocks
- Trading Signal
Reviews For QChartist
Reviews for this business have been aggregated from multiple sources.Based on 0 Reviews
Add ReviewMore About QChartist
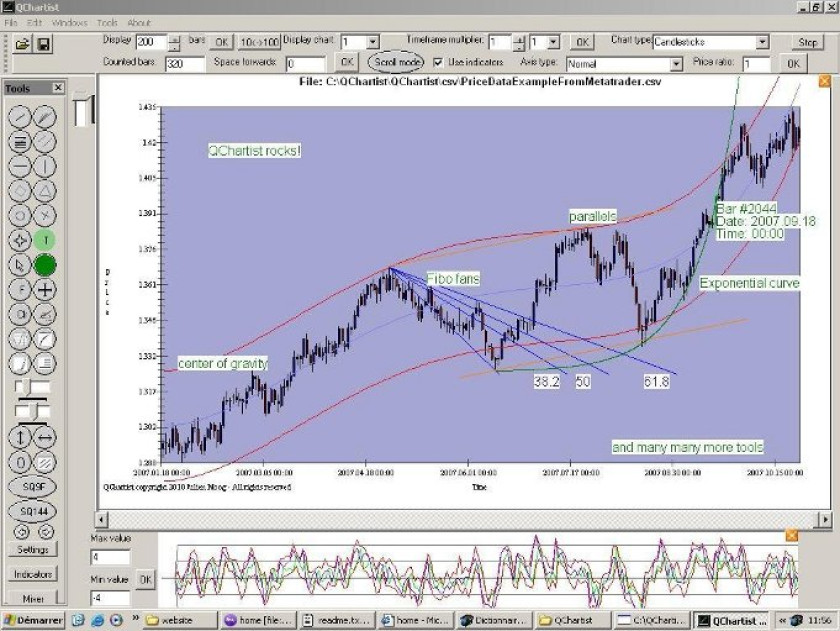
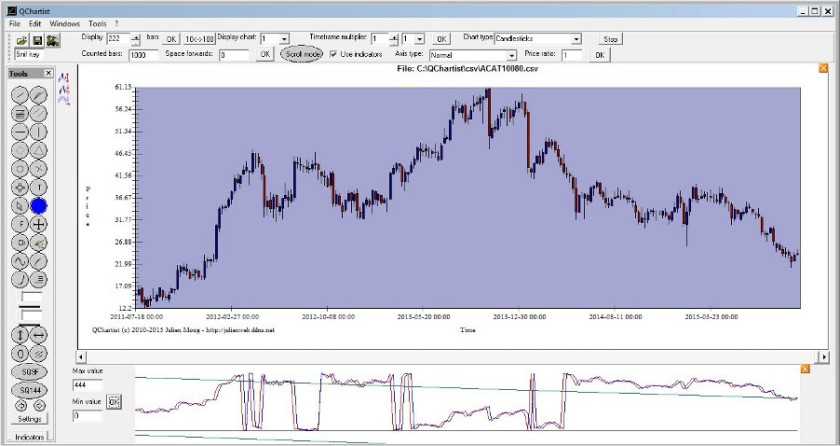
QChartist is an advanced charting and technical analysis software designed to help traders make informed decisions in the ever-changing financial markets. The software is open source and written in Basic and C++ language, allowing it to be easily extended with additional features and functionalities. QChartist provides a comprehensive set of tools to perform technical analysis on charts and data. This includes the ability to draw geometrical shapes on charts, plot programmable indicators from data, filter or merge datasets, utilize astronomical indicators and functions with a library for astronomical calculations, display charts by importing CSV files, change the timeframe multiplier, use a logarithmic axis type, display polar chart type, draw indicators on charts and create new ones, create exotic pairs with the mixer tool, build automated analysis with signals and alerts, integrated third party trading platform for market orders execution, and much more!
QChartist Gallery
- Business Details Unverified
-
Strasbourg
Strasbourg, Bas-Rhin 67000 FR - 06 16 84 34 81
- No. of Employees 1
- No. of Locations N/A
- Year Founded 2010
-
![SpiffyCharts]() SpiffyCharts
SpiffyCharts
0.0 No Ratings -
![]()
0.0 No Ratings -
![]()
0.0 No Ratings - More Charting and Analysis listings